A little side-project at home, as I found a use case for some Powershell scripting.
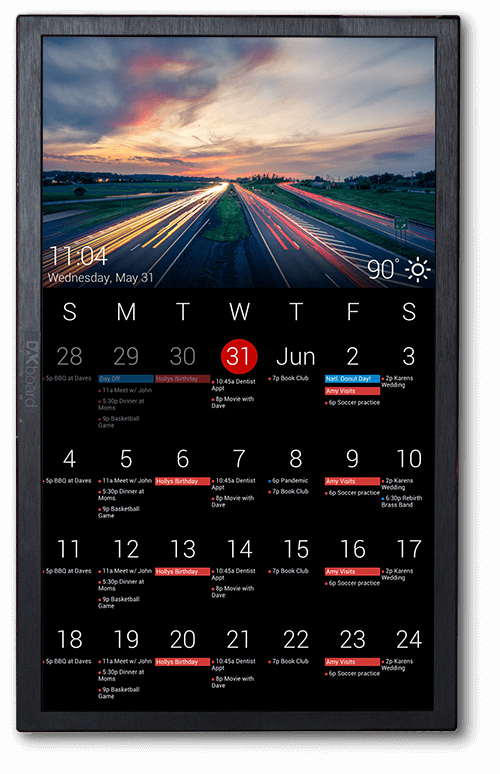
Not long ago I set up a DAKboard at the house, in order to keep track of our family’s activities. I use a Raspberry Pi and an old LCD monitor installed in the kitchen. I present a shared calendar as well as other useful information in the screen to make the everyday life a bit easier.
Recently we got new internet connectivity through the local ISP, Telenor. Living out in the countryside, it is based on LTE (as Telenor is phasing out their DSL solutions). Which in Norway means a bandwidth cap (in our case 1 TB per month). I live with a family of bandwidth hogs, so I wanted to keep track of the usage.
Initially that is visible in the ISP app and in their web portal. Not useful to others than myself. So why not put the information on our DAKboard? It will (hopefully) be useful to the rest of the family as well. Earlier I have created some Powershell scripts for posting useful stuff to Microsoft Teams, so this is somewhat similar.
High-level steps
- See what’s possible to present on the DAKboard, and how to configure it
- Find a way to extract the broadband usage data
- Save the usage data somewhere the DAKboard can read it
- Present the data on the DAKboard
- Run the script periodically
See what’s possible to present on the Dakboard, and how to do it
Logging into the DAKboard portal and my screen setup, I looked at the different available blocks available for customizing my screen.
Two possible options stood out:
- Website/iframe
- External Data/JSON
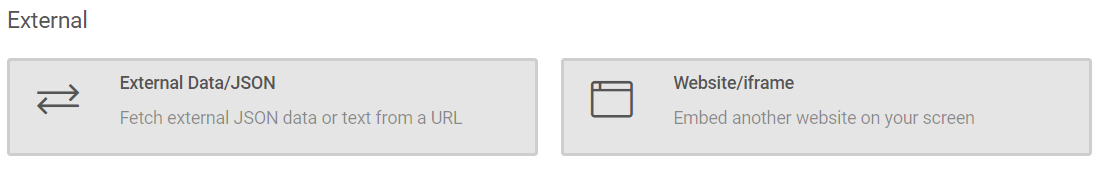
The JSON seemed the better way, as it will embed nicely with the screen’s appearance, keeping fonts, colors etc.
Find a way to extract the broadband usage data
There are two options of retrieving the bandwidth usage (apart from the ISP’s mobile app):
- Logging in to the ISP’s web portal.
- Logging in to the router’s admin portal. The router is a Huawei B818.
The first option requires logging in to the portal, using MFA (SMS only), then navigating to the correct page and reading the data. Since MFA is in play (which is a good thing), it complicates things when it comes to scripting.
Therefore I took a look at the second option. I logged in to the router, and found the usage data. I compared the stats with the ISP’s portal, and it seemed to be a difference in the data of about 2 GB. That could be a result of a delay, and anyway not a big issue and within an acceptable deviation.
I analyzed the router’s admin portal source code in the developer tools pane, and found some references to an API. Digging deeper, I found several API links.
One that stood out, matching my requirements, was this:
http://192.168.1.1/api/monitoring/month_statistics
Opening that URL, I saw the following.
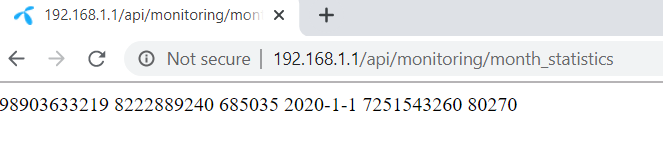
This will simplify things, as I can use this without calling a browser session, logging in and navigating to the right page. I also will run the script from a server in my home network, so I have access directly to the API.
Save the usage data somewhere the DAKboard can read it
I decided to use this as the master data, and when summarizing inbound and outbound traffic, I was within 2 GB of the usage value at the ISP’s portal, as mentioned above.
I wrote a script to parse the amount data needed, summarizing inbound and outbound data usage. Also stripped out what I didn’t want using regex
Further I use this value and insert it in a here-string formatted in JSON together with the current month (in Norwegian locale). Please adapt this section to your liking
This variable is written to a customized JSON file stored locally (will be overwritten at each run)
Upload the JSON to a webhost, (through FTP using the PSFTP Powershell module. The module is a personal preference, as I have used it earlier)
Important notice: Not all webhosts support JSON as good as others, so verify that before continuing. For this exercise I choose the free 000webhost.com, as they support this functionality.
To get some initial data and verify functionality, I ran the script manually. I have shared the script in my Github repo here.
Present the data on the DAKboard
I went back to the DAKboard configuration panel, and prepared a JSON block. I added the URL where I uploaded the JSON file, and let DAKboard parse it. I see the fields I created, and the values in the file.
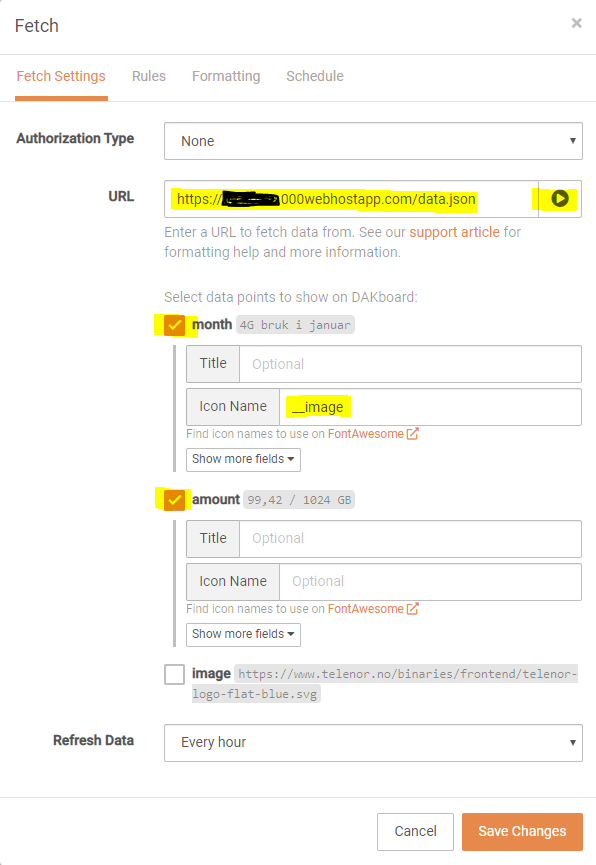
Remember to use https, not http.
- I checked the boxes I wanted (all, apart from image, explained next
- I also I wanted a (transparent) icon for my ISP, I added that as well. Remember to not check the box for the icon, instead refer to it with a __ prefix under icon in the month section in the screenshot.
- I wanted to refresh the data every hour, so I configured an update every 60 minutes.
- I did a preview to see if things appeared as they should.
Run the script periodically
As I will run this script from my internal network, I added this as a scheduled task on one of my servers at home. Since my script requires the PSFTP module, I need to add that to the server as well.
The script is set to run every hour, aligning with the refresh of the DAKBoard.
The completed script now looks like this on the DAKboard (sorry for the Norwegian, please adapt as you see fit). The JSON is parsed nicely aligning with the other design elements of the screen:
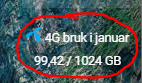
Now I can have the family members looking at the DAKboard to keep an eye on the bandwidth usage.