Last year we built a greenhouse in our garden. This year is the first full season of usage, and we look forward to fresh vegetables from our own garden.
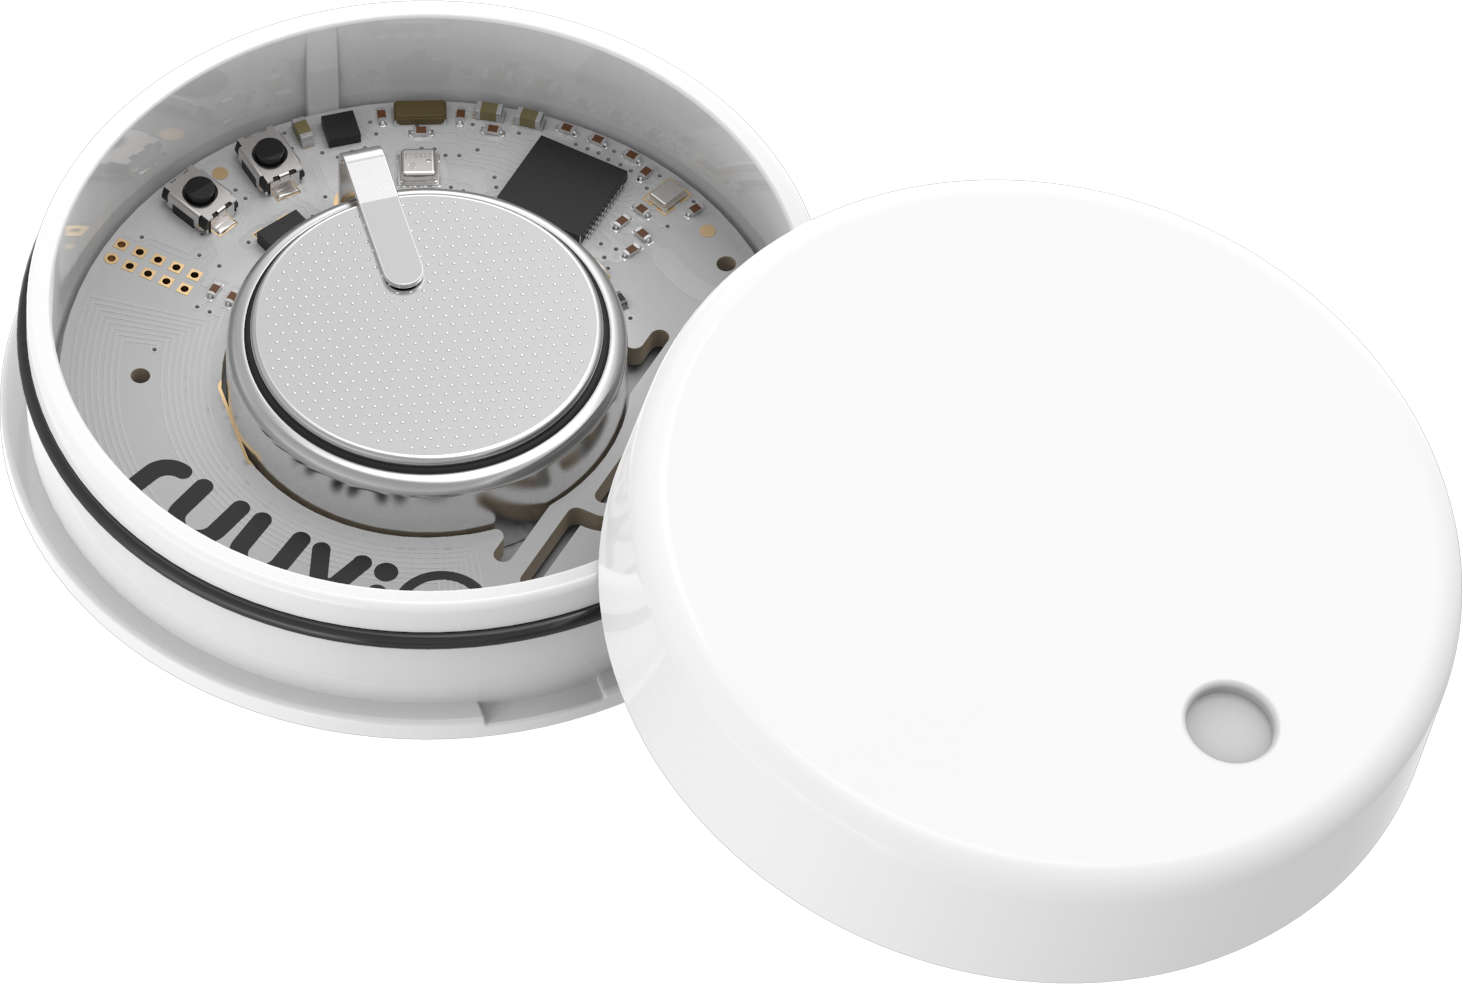
However, as temperatures often rise to critical levels, it is important to keep track of the changes. I thought about adding another sensor to my Netatmo, but that is not supported. After searching online, I came across Ruuvi, which are Bluetooth tags (BLE) for sending temperature, humidity, air pressure and motion to either an app on your smartphone, or to a central hub. However, I would like to centrally collect data over time to see trends and historical data.

I found out that many people use a Raspberry Pi as the hub, gather the data there in a database, and present it via Grafana dashboards.
Also I would like to have the possibility to check the dashboards while away from home. Grafana is default http on port 3000, and I didn’t want to publish that on the internet. So I also set up Nginx as a reverse proxy with Let’s Encrypt certificates for the Grafana dashboards.
Overview of required components:
- Raspberry Pi (I had a Model 4 available)
- Raspbian (I downloaded the full desktop, as I run a web browser on my Raspberry with a 7” touchscreen)
- RuuviCollector
- Grafana (pick the latest version)
- InfluxDB (select amd64 package and replace the amd64 with armhf. For example: https://dl.influxdata.com/influxdb/releases/influxdb_1.5.2_amd64.deb becomes https://dl.influxdata.com/influxdb/releases/influxdb_1.5.2_armhf.deb)
- Ruuvi tag/tags
- Nginx (if you want remote access to Grafana)
- Let’s Encrypt certificates
- DDNS service if you’re not on a fixed IP (I use joker.com with my own domains, free)
Extra for my setup, using an extra Raspberry Pi with a 7” touchscreen as a kiosk
High-level overview:

The Ruuvi tag(s) will broadcast sensor data over Bluetooth. The Raspberry Pi will listen and capture, and save the data in an InfluxDB database. Grafana is set up with the InfluxDB database as a data source, and I will create dashboards for presenting the data. From inside the home LAN, I will be able to access Grafana, no problem. But from the internet, I need a secure way of accessing the same data when I’m not home. I configure Nginx as a reverse proxy behind my firewall, and terminate the TLS connection there. From Nginx, the requests will be forwarded internally to Grafana. I choose to use Let’s Encrypt for getting TLS certificates, and a crontab will check periodically for certificate expiration date. When near expiration, the certificates will auto-renew.
As my ISP is dynamically assigning IPs, I need to use a crontab to run a script for checking my IP, and if changed since last run, update the DNS record. I use Joker.com for my domains, and they provide a free DDNS where you can use your own domains.
Setup:
As many have documented the setup, I will only provide links:
- Setting up Raspberry Pi as a Ruuvi Gateway. I used this as a starting point (I did not set up WiFi hotspot or enabled anonymous access)
- Nginx setup with Let’s Encrypt. From here I used the Nginx and Certbot part (no Node-Red etc). I have adjusted my Nginx configuration to make it more secure, also I ran some SSL tests to verify.
- In addition you need to forward port 443 TCP to your server for accessing it from the outside. Also port 80 TCP for Let’s Encrypt HTTP challenge if not able to use DNS challenge.
- Joker.com DDNS renewal script (remember to install dnsutils, if not dig will fail), run periodically via crontab (for example every 15 minutes):
#!/bin/sh

set -x

NS=a.ns.joker.com
HOSTNAME=your.custom.hostname.com
USERNAME=ddns-user
PASSWORD=ddns-password

DDNS=$(dig @$NS $HOSTNAME +short)
IP=$(curl -s http://ifconfig.me)

if [ $IP != $DDNS ]
then
        curl -q "https://svc.joker.com/nic/update?username=${USERNAME}&password=${PASSWORD}&hostname=${HOSTNAME}" | \
                logger -t ddns -p alert
else
        logger -t ddns -p alert No change: $IP
fi
There are plenty of information out there about this, so the setup was rather quick to get up and running.
Creating the dashboards is pretty straight forward, and after a short while I was happy. As I purchased a 3-pack of sensors, I placed them around the property. One in the greenhouse, one in the basement and the last in the shed hosting our water supply. I will probably adjust them as I go along.

The nice thing about Grafana, is that it is also possible to set up alerts. Microsoft Teams is supported, as well as Pushover and a ton of other providers.

So if the temperature in the greenhouse is over for example 35 degrees, I can get a push notification.
In addition, I integrated Azure AD authentication, so that users I give access to the Grafana app in my Azure AD tenant can login to Grafana. These users all need to use MFA, so that increases security.
I followed the documentation at Grafana, found here. Pretty straight forward, the only thing to remember is that the redirect URI (reply URL) defined in the Azure app registration must match the root_url in grafana.ini.
In addition, you can remove the default login box if you just want to use Azure authentication.
Extra setup:
- Install Raspbian on the Raspberry Pi, run updates, assemble the screen and install everything in the case.
- Due to the case, the screen is mounted upside down. Flip the picture 180 degrees by adding this to /boot/config.txt:
lcd_rotate=2 - Disable power management (to keep the screen from turning off/blanking) by adding the following to /etc/xdg/lxsession/LXDE-pi/autostart:
@xset s off @xset -dpms - Install unclutter for hiding the cursor when inactive:
sudo apt-get install unclutter - Optional: turning the screen off at night (at 22:00) and on in the morning (at 07:00). Add the following to crontab (sudo crontab -e):
0 22 * * * sudo sh -c 'echo "1" > /sys/class/backlight/rpi_backlight/bl_power' 0 7 * * * sudo sh -c 'echo "0" > /sys/class/backlight/rpi_backlight/bl_power' - Install grafana-kiosk
- Add the start up parameters to the autostart script, default it is located here /home/pi/.config/lxsession/LXDE-pi/autostart. For example starting grafana-kiosk locally with local user authentication:
./bin/grafana-kiosk --URL https://localhost:3000 --login-method local --username admin --password admin --kiosk-mode tvAll the possible parameters are outlined on the grafana-kiosk Github.
The result after tweaking the dashboard could look something like this (in Norwegian), showing current temperatures for 3 Ruuvitags and my Netatmo as well as a graph of temperature for the last 24 hours:

